Quickstart
Go from sign-up to your first nature and climate results.
Nios measures the nature and climate impacts of the goods and services your organization buys (Scope 3.1, purchased goods and services). This quickstart takes you from sign-up to exported results with your own purchase data.
Each step shows what it looks like for Aamu Foods, a fictional Nordic food company that measures the impacts of its 2025 purchases.
Set up
Create your organization and a project for the reporting period you want to measure.
Create your account and organization
Go to app.nios.earth/sign-up and sign up with Google or your email address. With an email address, Nios sends you a code to confirm it, then asks for your first and last name. Next, create your organization with a name and, optionally, a logo.
Already have an account? Sign in and continue with Create a project.
Create a project
On the Projects page, click Create project. Enter a name and the reporting period. Aamu Foods names its project "Aamu Foods FY2025" with the reporting period "2025".
A project holds the data and results of one reporting period. See Projects.
Collect data
Bring your purchases into Nios, from a spreadsheet or directly in the app, match them to sectors, and refine the results per activity. See Collect data.
Add your purchases
Add one row per purchase on Activities: at least the Activity, plus Spend and Currency, or Quantity and Unit. For spend, also add the Activity year and Country of production. A Supplier helps sector matching.
Use a spreadsheet for many purchases, for example an export from your ERP system. Click Get started to open Add data, then Download the Spreadsheet template and fill in the Activities sheet. Aamu Foods fills it with its 2025 purchases:
| Activity | Supplier | Activity year | Country of production | Spend | Currency |
|---|---|---|---|---|---|
| Wheat flour | Kantele Mills | 2025 | Finland | 2450000 | EUR |
| Palm oil, refined | Sumatra Agri Oils | 2025 | Indonesia | 1350000 | USD |
| Cocoa mass | Côte Cacao Partners | 2025 | Côte d'Ivoire | 2100000 | USD |
The template uses the same sheets, columns, and lists as Nios, so the import reads it without any column mapping. Drop the filled template on Add data, or click Choose file. Nios imports Aamu Foods' 21 activities.
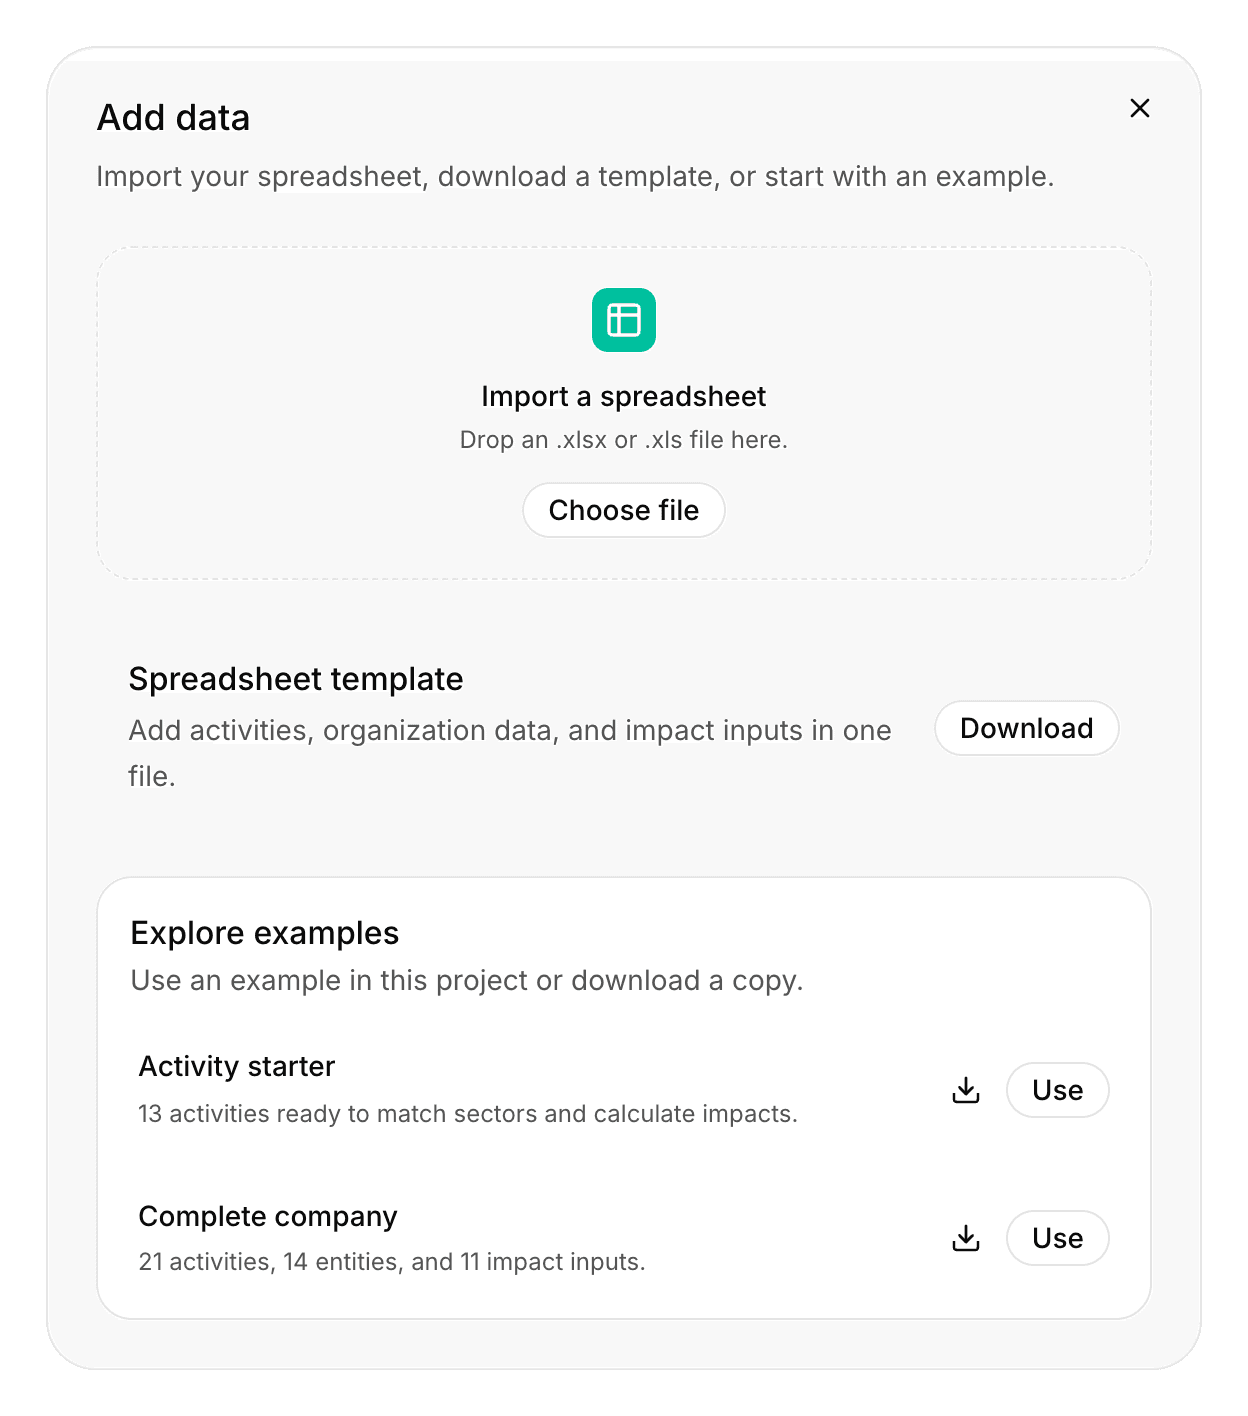
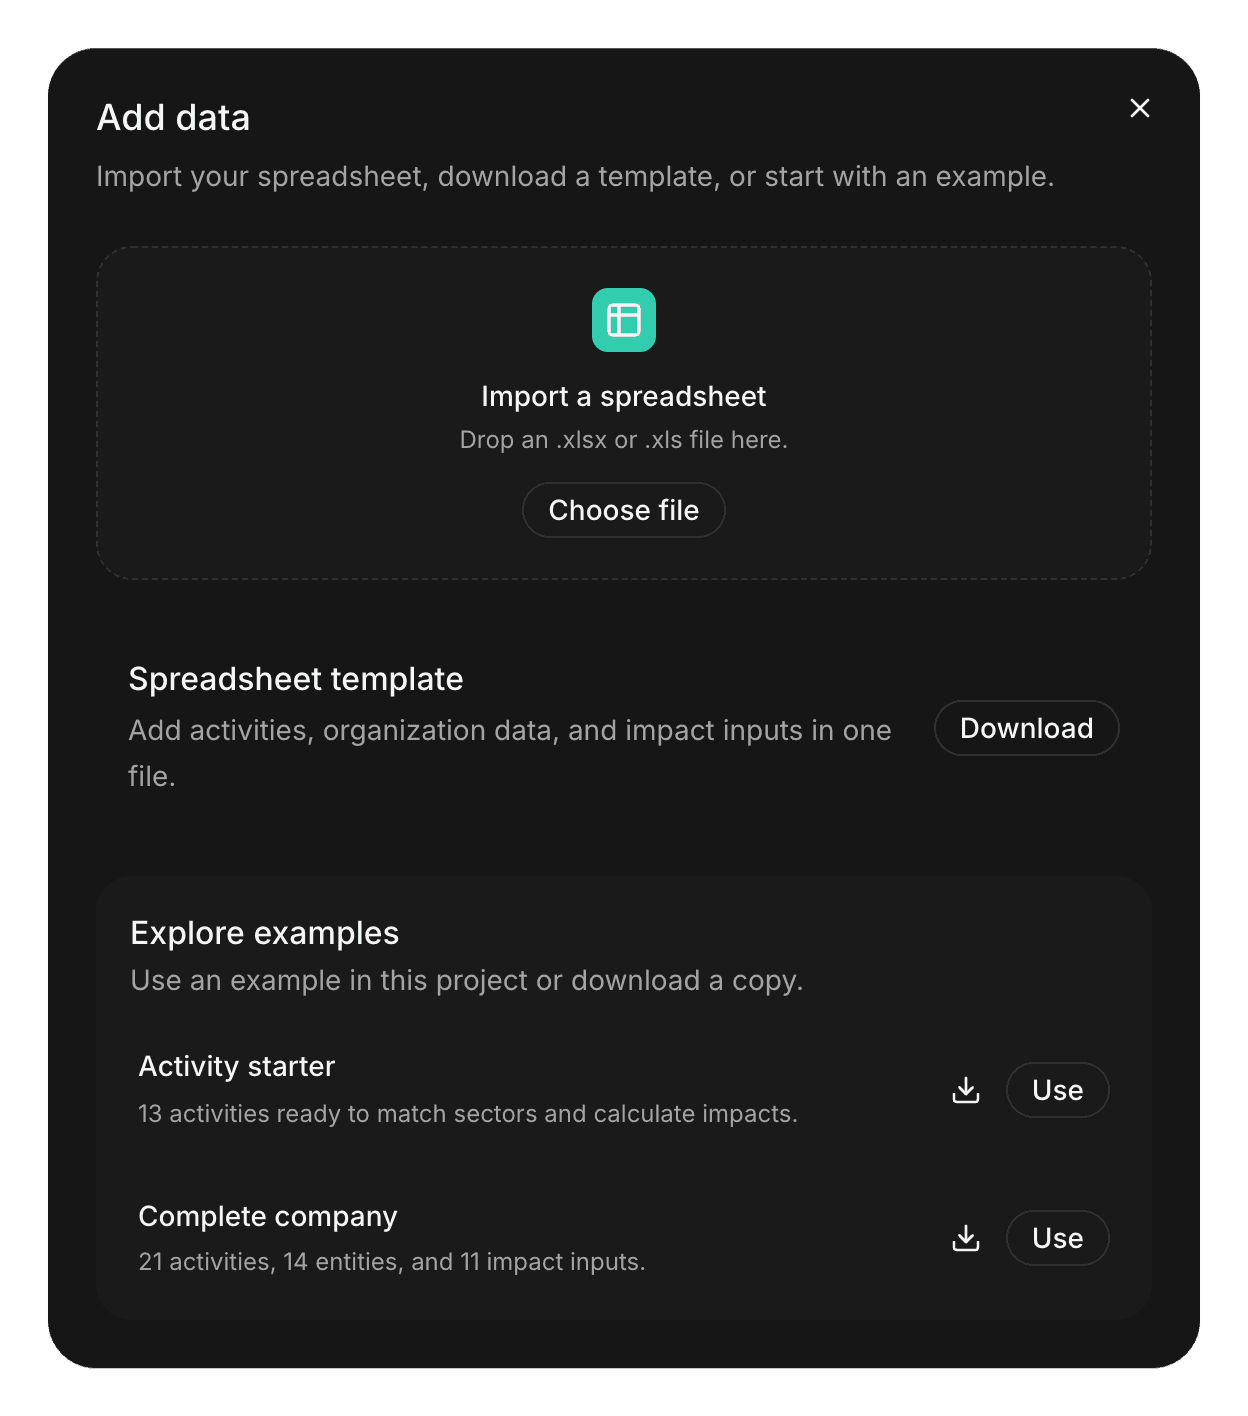
To try the workflow before you prepare your own file, click Use next to one of the examples in the same dialog. See Import and export and Spreadsheet template.
Enter purchases directly in the grid, for example to add a few purchases or complete an import. Click Insert row at the bottom of the grid and type the values into the cells. You can also paste values copied from a spreadsheet into existing rows.
Your changes save automatically. See Activities for what each column does.
Fix errors
Nios checks your purchases when you import them and as you edit them. If it finds problems, the status bar shows errors. Open the side panel with Open panel in the top right and choose the Issues tab.
Two of Aamu Foods' rows have "Finnland" as country of production. The Issues tab groups them and suggests Finland, and Fix corrects both rows at once. See Issues.
Match activities to sectors
The status bar reads "21 activities ready for matching." Click Match. Nios finds a base sector for each activity, derives from it the best sector for each environmental pressure (metric), such as GHG emissions or land occupation, and then calculates the impacts. The status bar shows "Matching activities to sectors" and then "Calculating impacts".
When the status bar reads "All 21 activities calculated.", every activity has results. If some activities stay uncalculated, the Issues tab tells you why. See Sector matching.
Refine each activity
Select an activity and choose Matching > Activity in the side panel. It shows the activity's base sector, the metric sector behind each metric, and each metric's result.
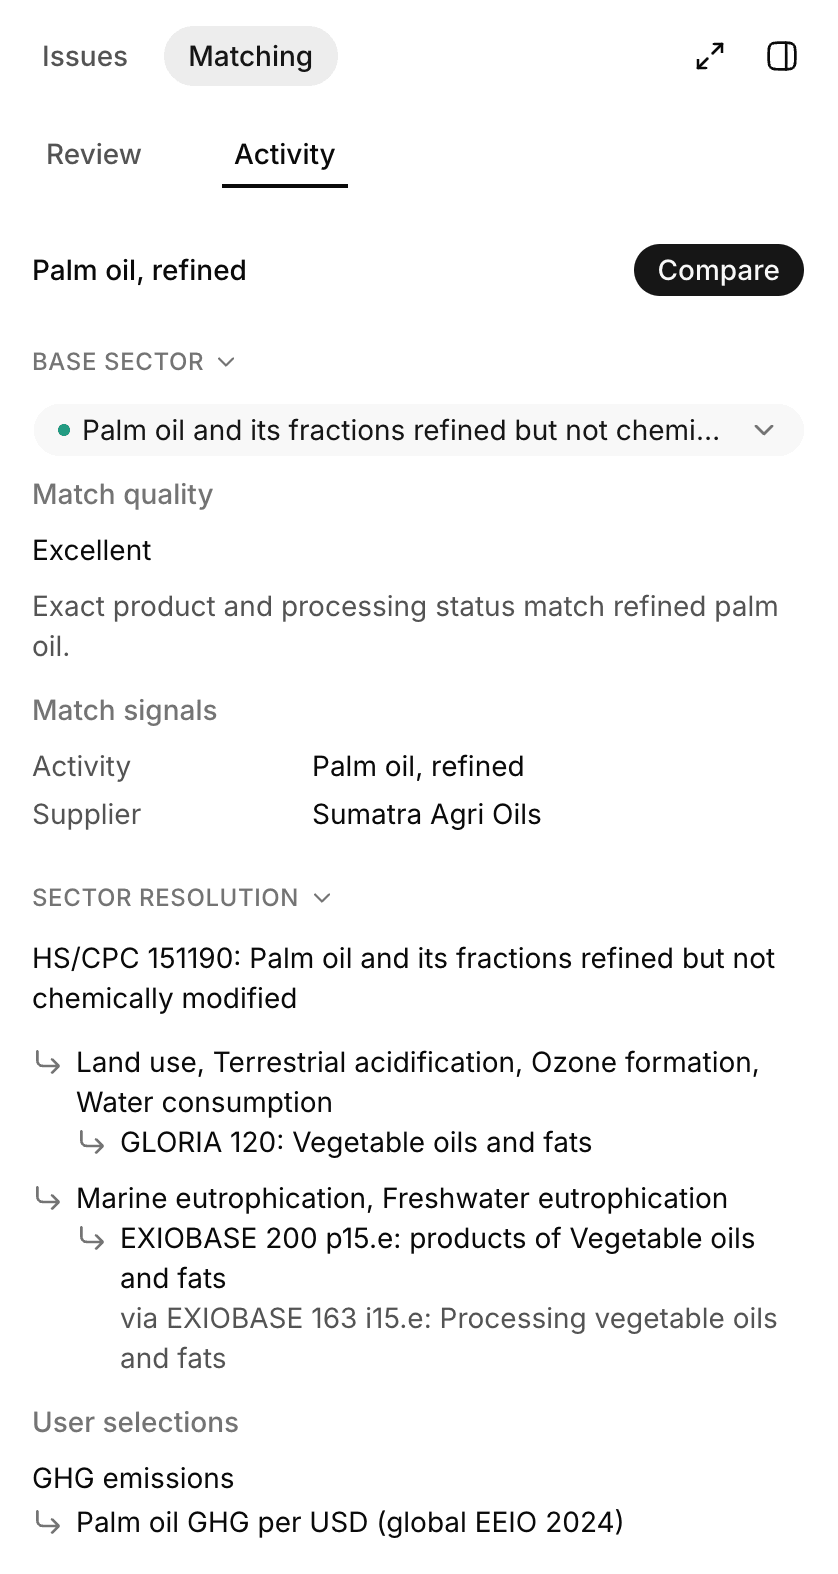
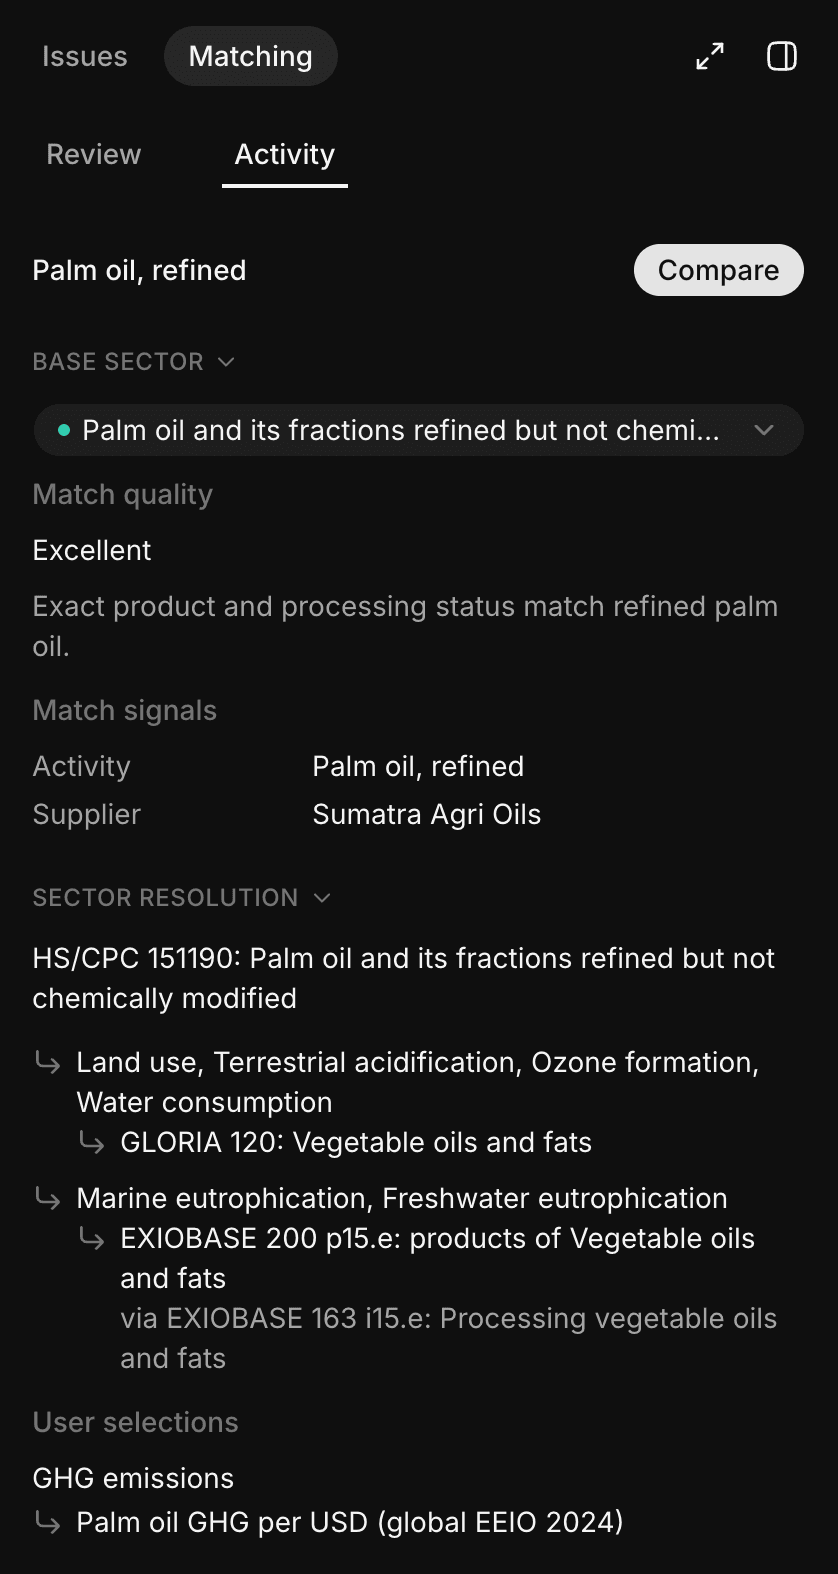
If a result doesn't fit the purchase, select a better base sector, or expand a metric to change its metric sector or country. Nios recalculates the activity after every change, in the panel or the grid, so you see the effect right away.
Aamu Foods starts with its largest purchases, such as palm oil, and checks that each one resolves to sectors that describe it. See Sector matching.
Measure impacts
Nios shows your results in two places: charts on the Impacts page, and the Results sheet with every value per activity. You can export both. See Measure impacts.
Explore the charts
Open Impacts in the sidebar. Its charts show the results of every calculated activity, even while some activities still have errors.
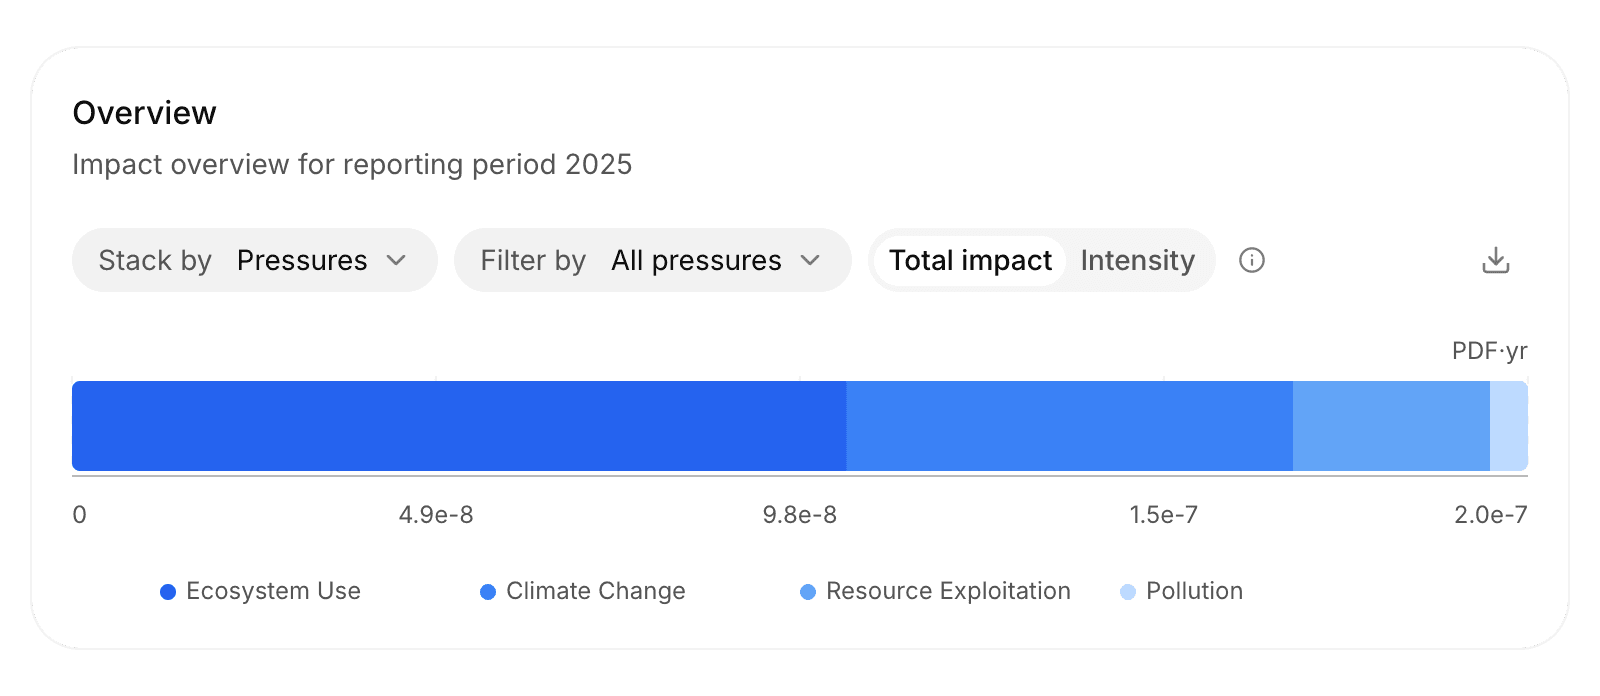
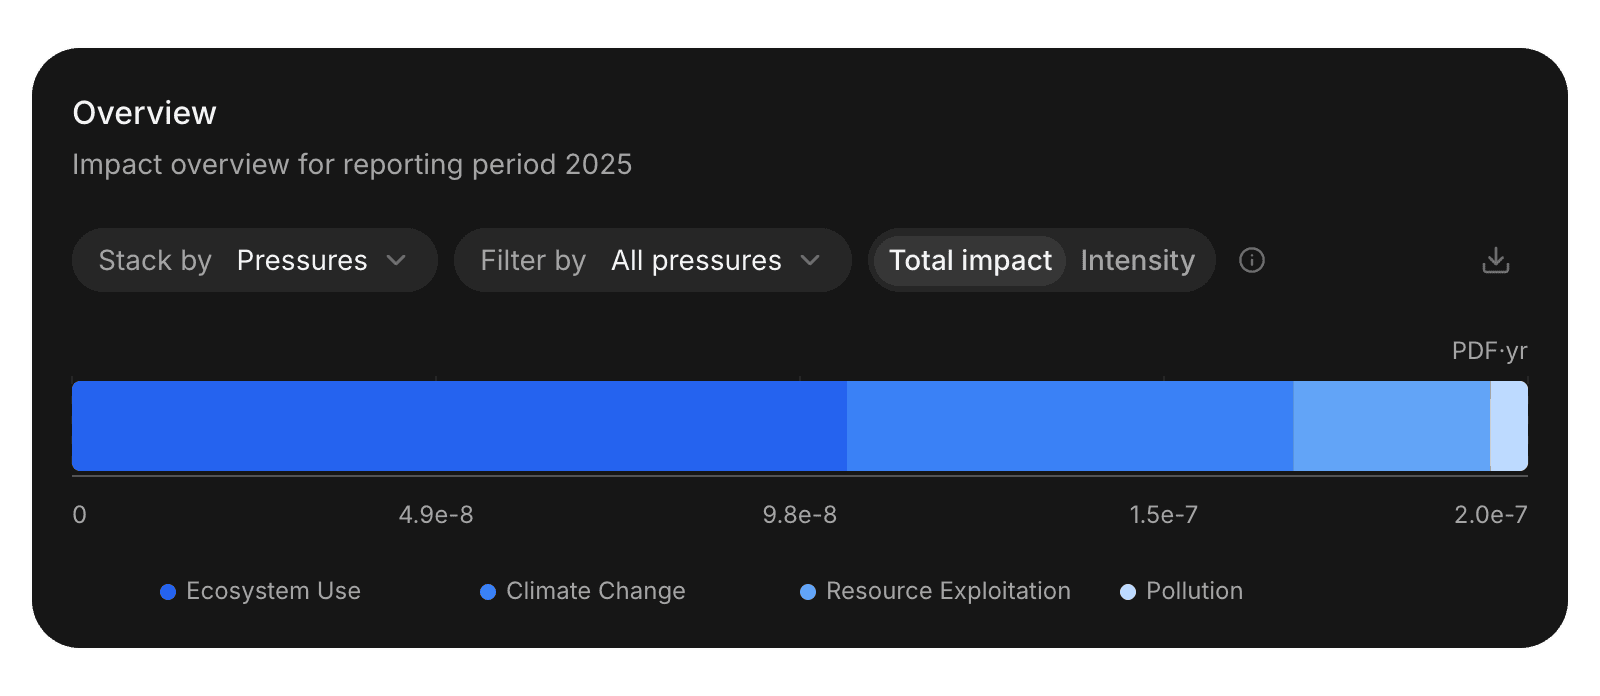
The page opens on the Nature lens with biodiversity impact in PDF·yr. Switch to Climate for GHG emissions in t CO₂e. The Impact Source card ranks what contributes most: for Aamu Foods, cocoa mass leads the Nature list. See Impact dashboard.
Check the results per activity
Click Results to open a sheet with one row per activity. It lists each metric's pressure and impact, and you can hover a value to see how Nios calculated it. See Results and export.
Export charts and results
- Charts: Export all charts downloads every chart as PNG or SVG, for slides and reports.
- Results: Export results in the Results sheet downloads a workbook with the values you see.
See Results and export.
Need help?
- Support: Contact our team via hello@nios.earth.
- Data security: Review how we handle your confidential data in our Data Processing Addendum.
- Privacy: Review our privacy policy to understand how your personal information is protected.